Lunora Studio: your backend, in the open
A local admin UI for your schema, data, SQL, dashboards, time-travel, and workflows — running against your live edge database, with nothing to install.
Every Lunora app ships with Studio, a local admin UI for your schema, data, SQL, logs, and
time-travel that runs against your live edge database. Nothing to install, no separate dashboard to
host, no credentials to wire up. Run pnpm dev and it's there, sitting next to your app on the same
dev server.
It's the missing console for a Cloudflare-native backend: one place to watch state change, poke at data, run a query, rewind a shard, and catch schema mistakes — all without leaving your machine.
What you get
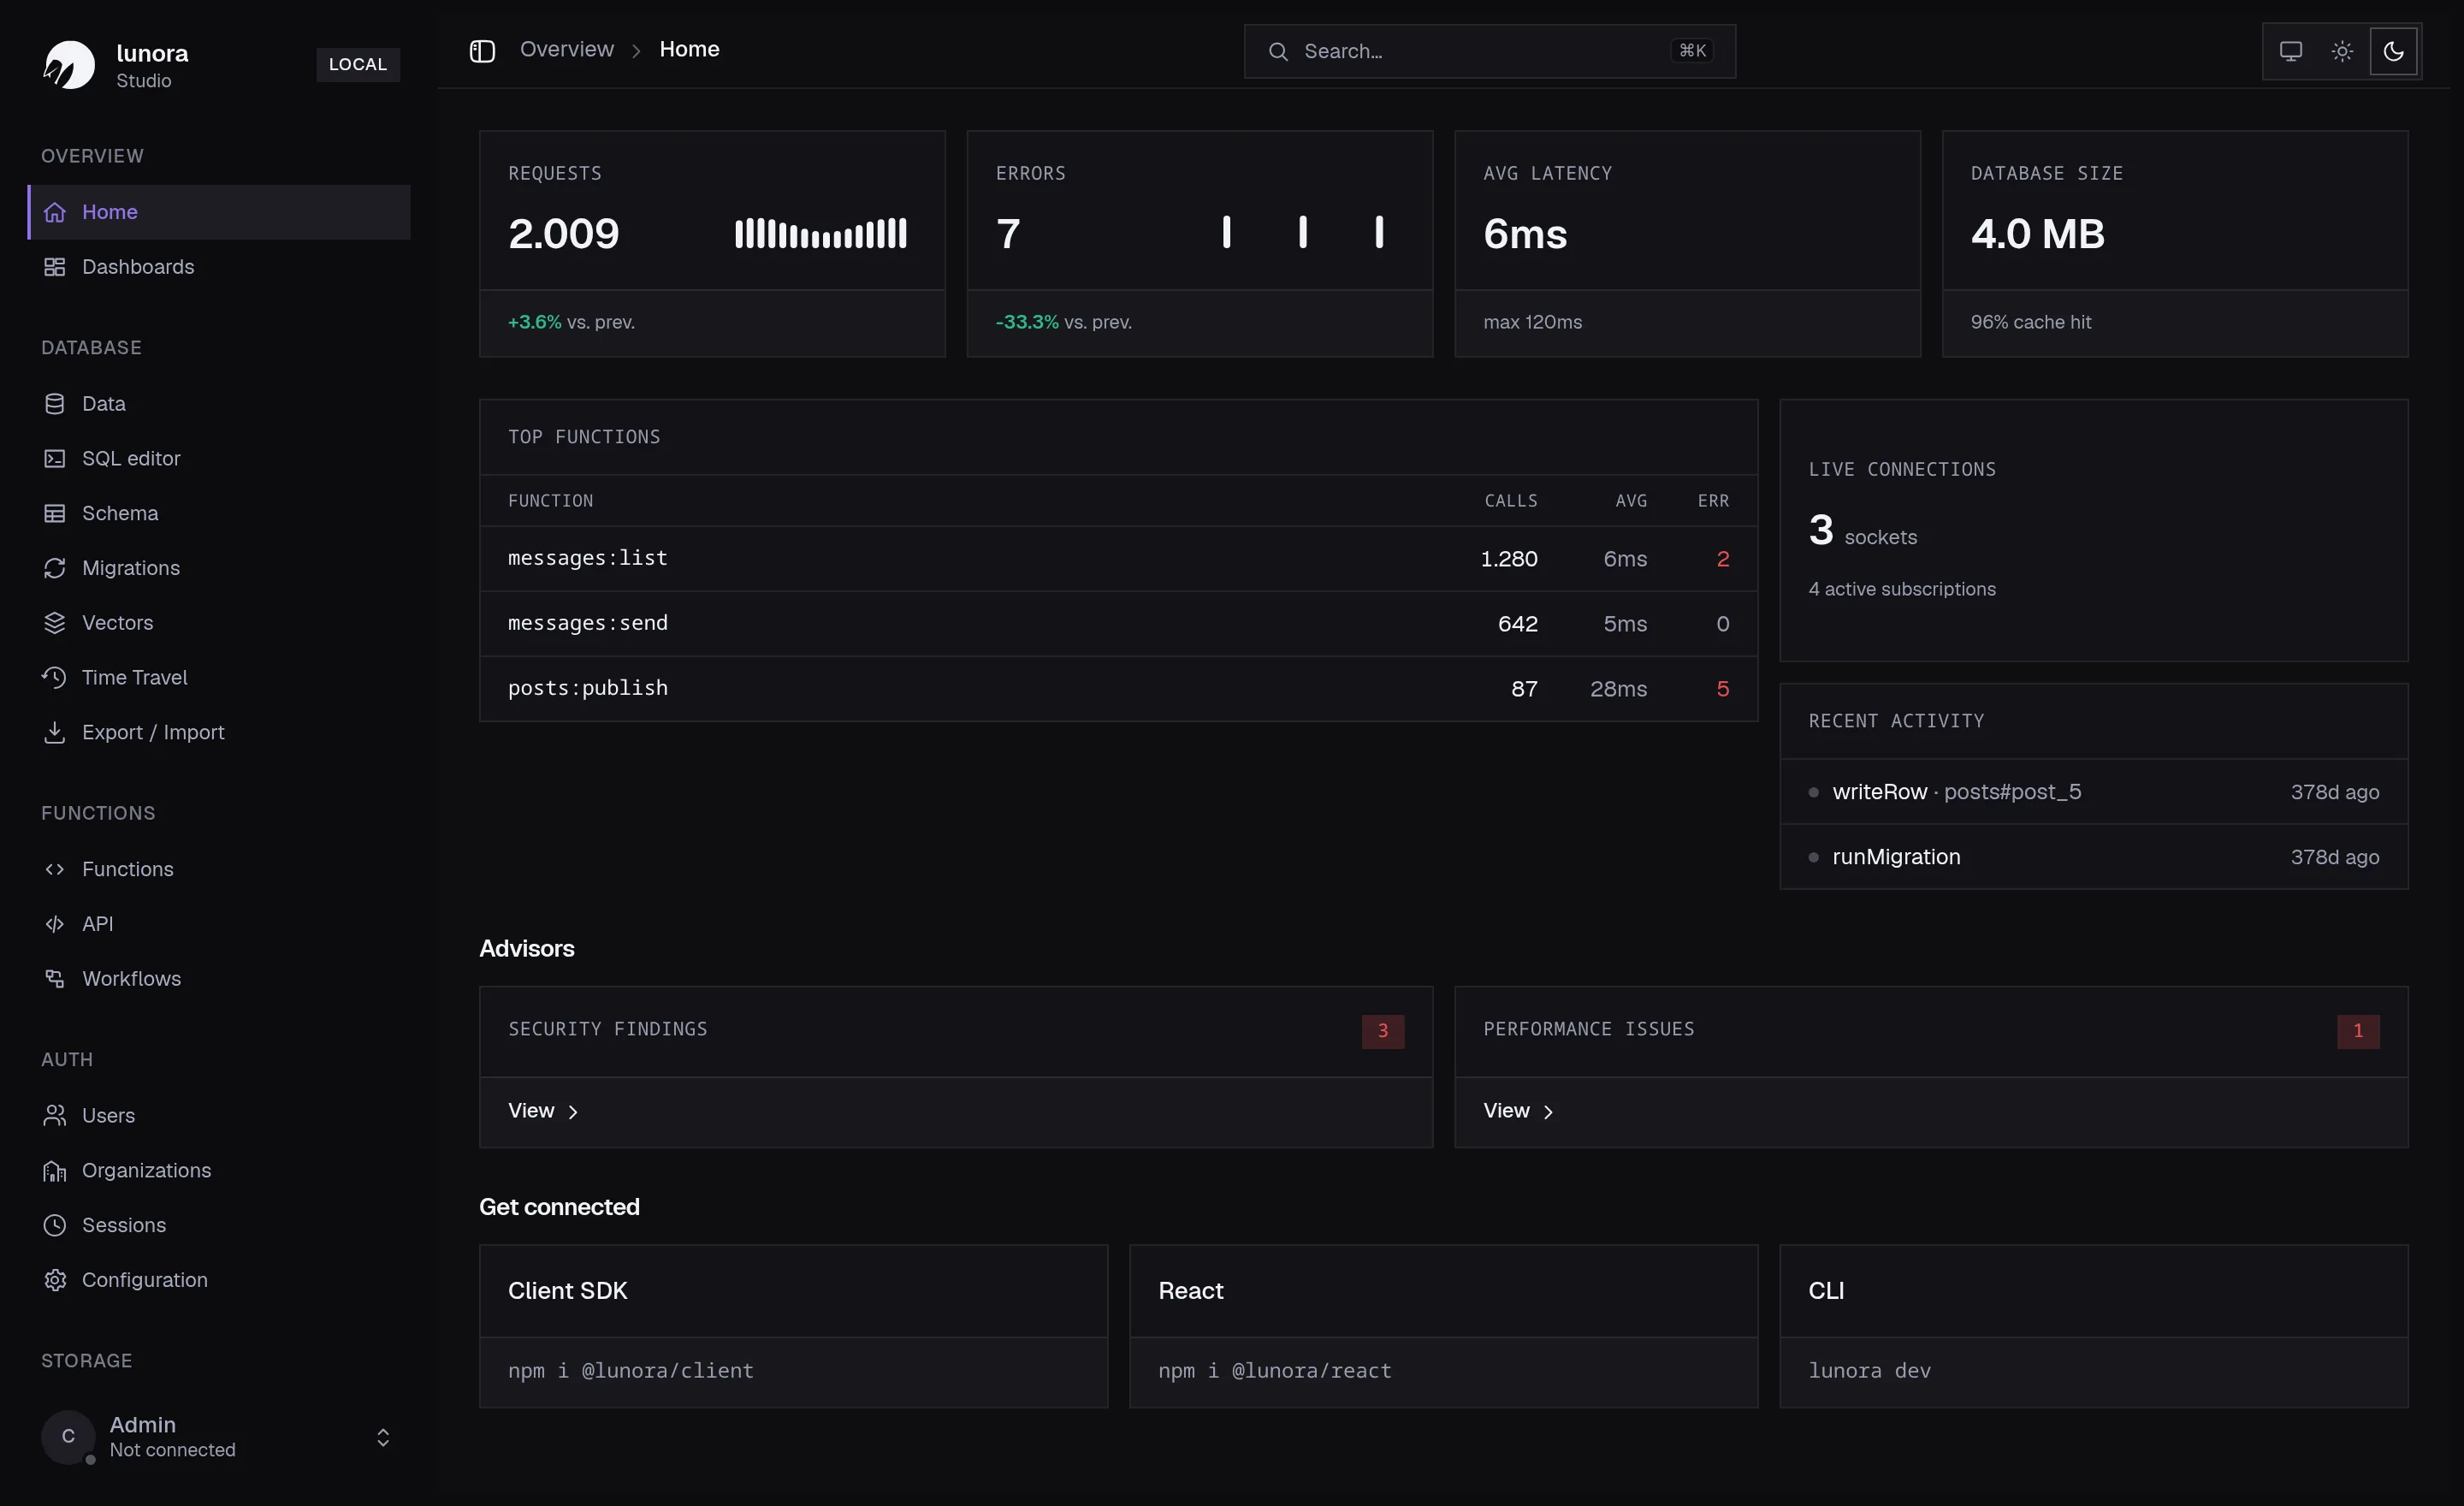
- A live overview — requests, errors, latency, database size, top functions, and live socket counts at a glance.
- A data browser — every table, every shard, edit rows inline.
- A SQL editor — run read or write SQL, chart the result, or
EXPLAINit. - Dashboards — pin saved queries as chart widgets.
- A schema view — shard-local and global (D1) tables, as a list or a graph.
- Time Travel — scrub any shard back to any moment in the last 30 days and restore it.
- Workflows — start durable Cloudflare Workflows and watch each instance run.
- Auth & storage — browse users, organizations, sessions, and bucket contents.
- Advisors — schema and query lints that flag the footguns before they ship.
A live overview
The home screen is the pulse of your backend: request and error counts, average latency, database size, your busiest functions, live WebSocket connections, and the most recent writes — plus a Get connected panel with the exact install snippets for the client SDK, React, and the CLI. Open it on a second monitor while you build and you'll see every mutation land in real time.
Browse and edit your data
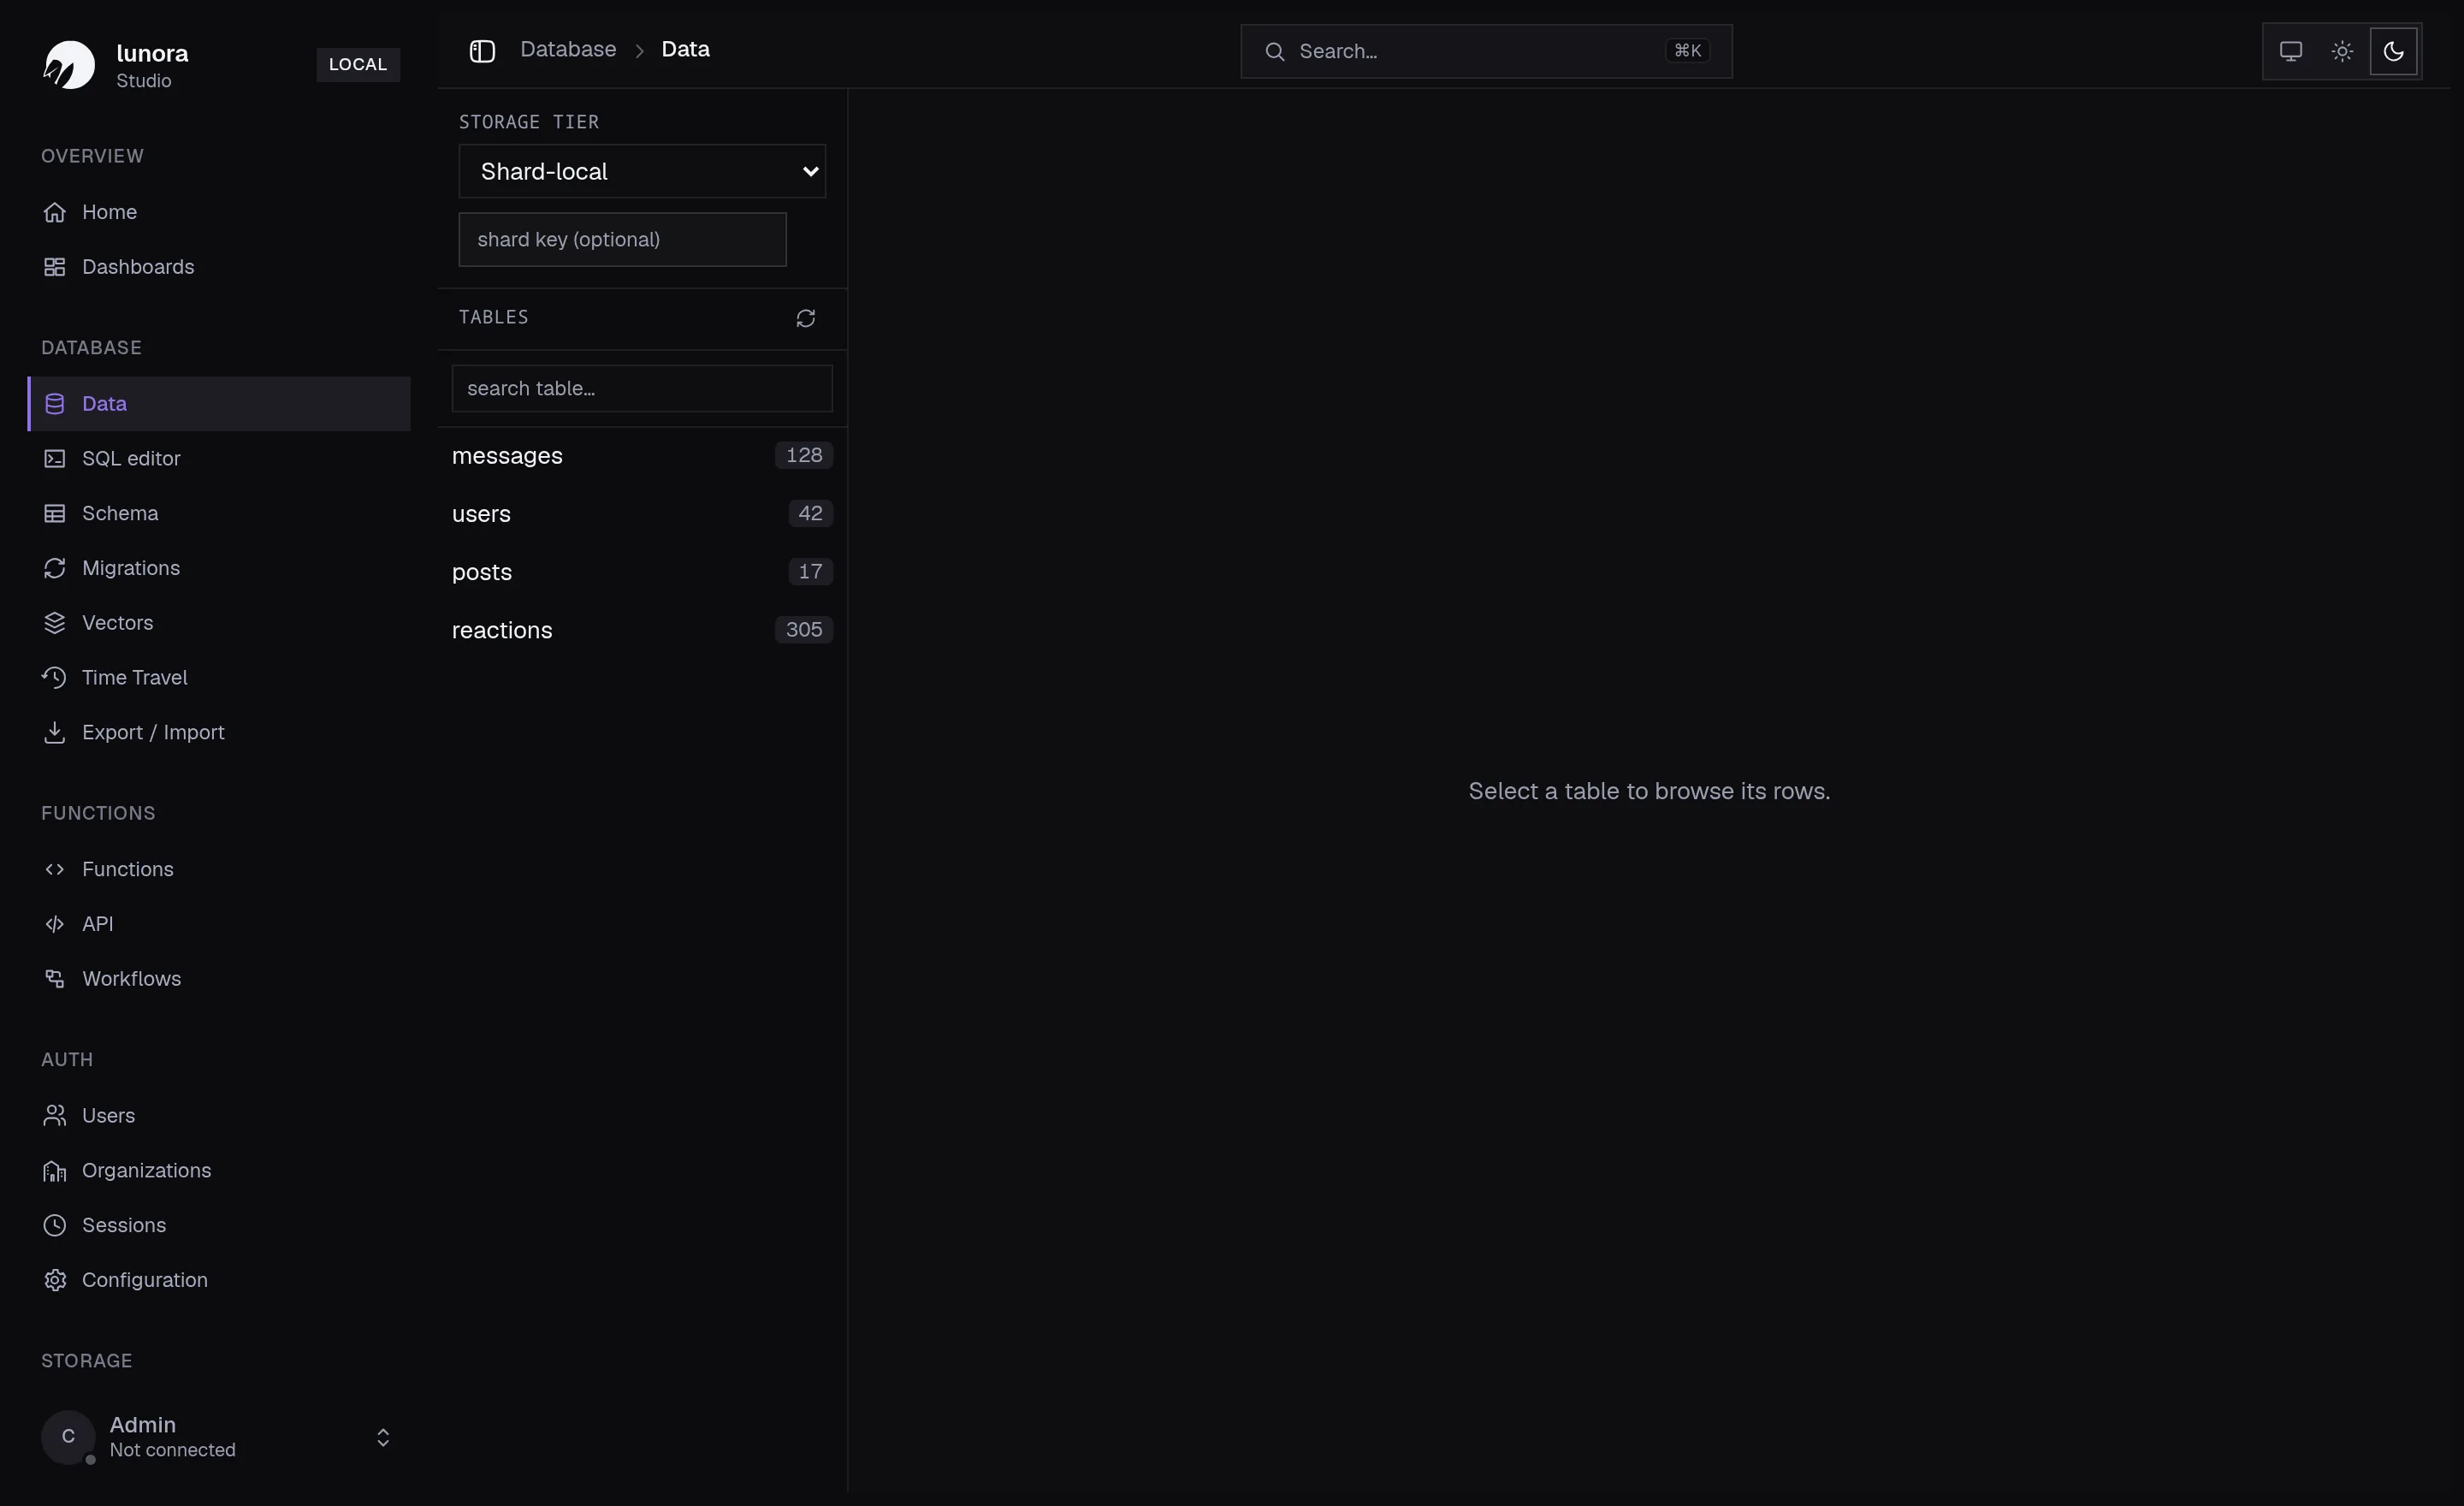
The data view lists every table with its row count. Pick a storage tier (shard-local or global), optionally pin a shard key, and browse or edit rows directly. Because Studio subscribes to the same live queries your app does, the data updates as mutations land — when something looks off, it's usually faster to watch Studio for a few seconds than to add a log line and reload.
Run SQL, chart the result
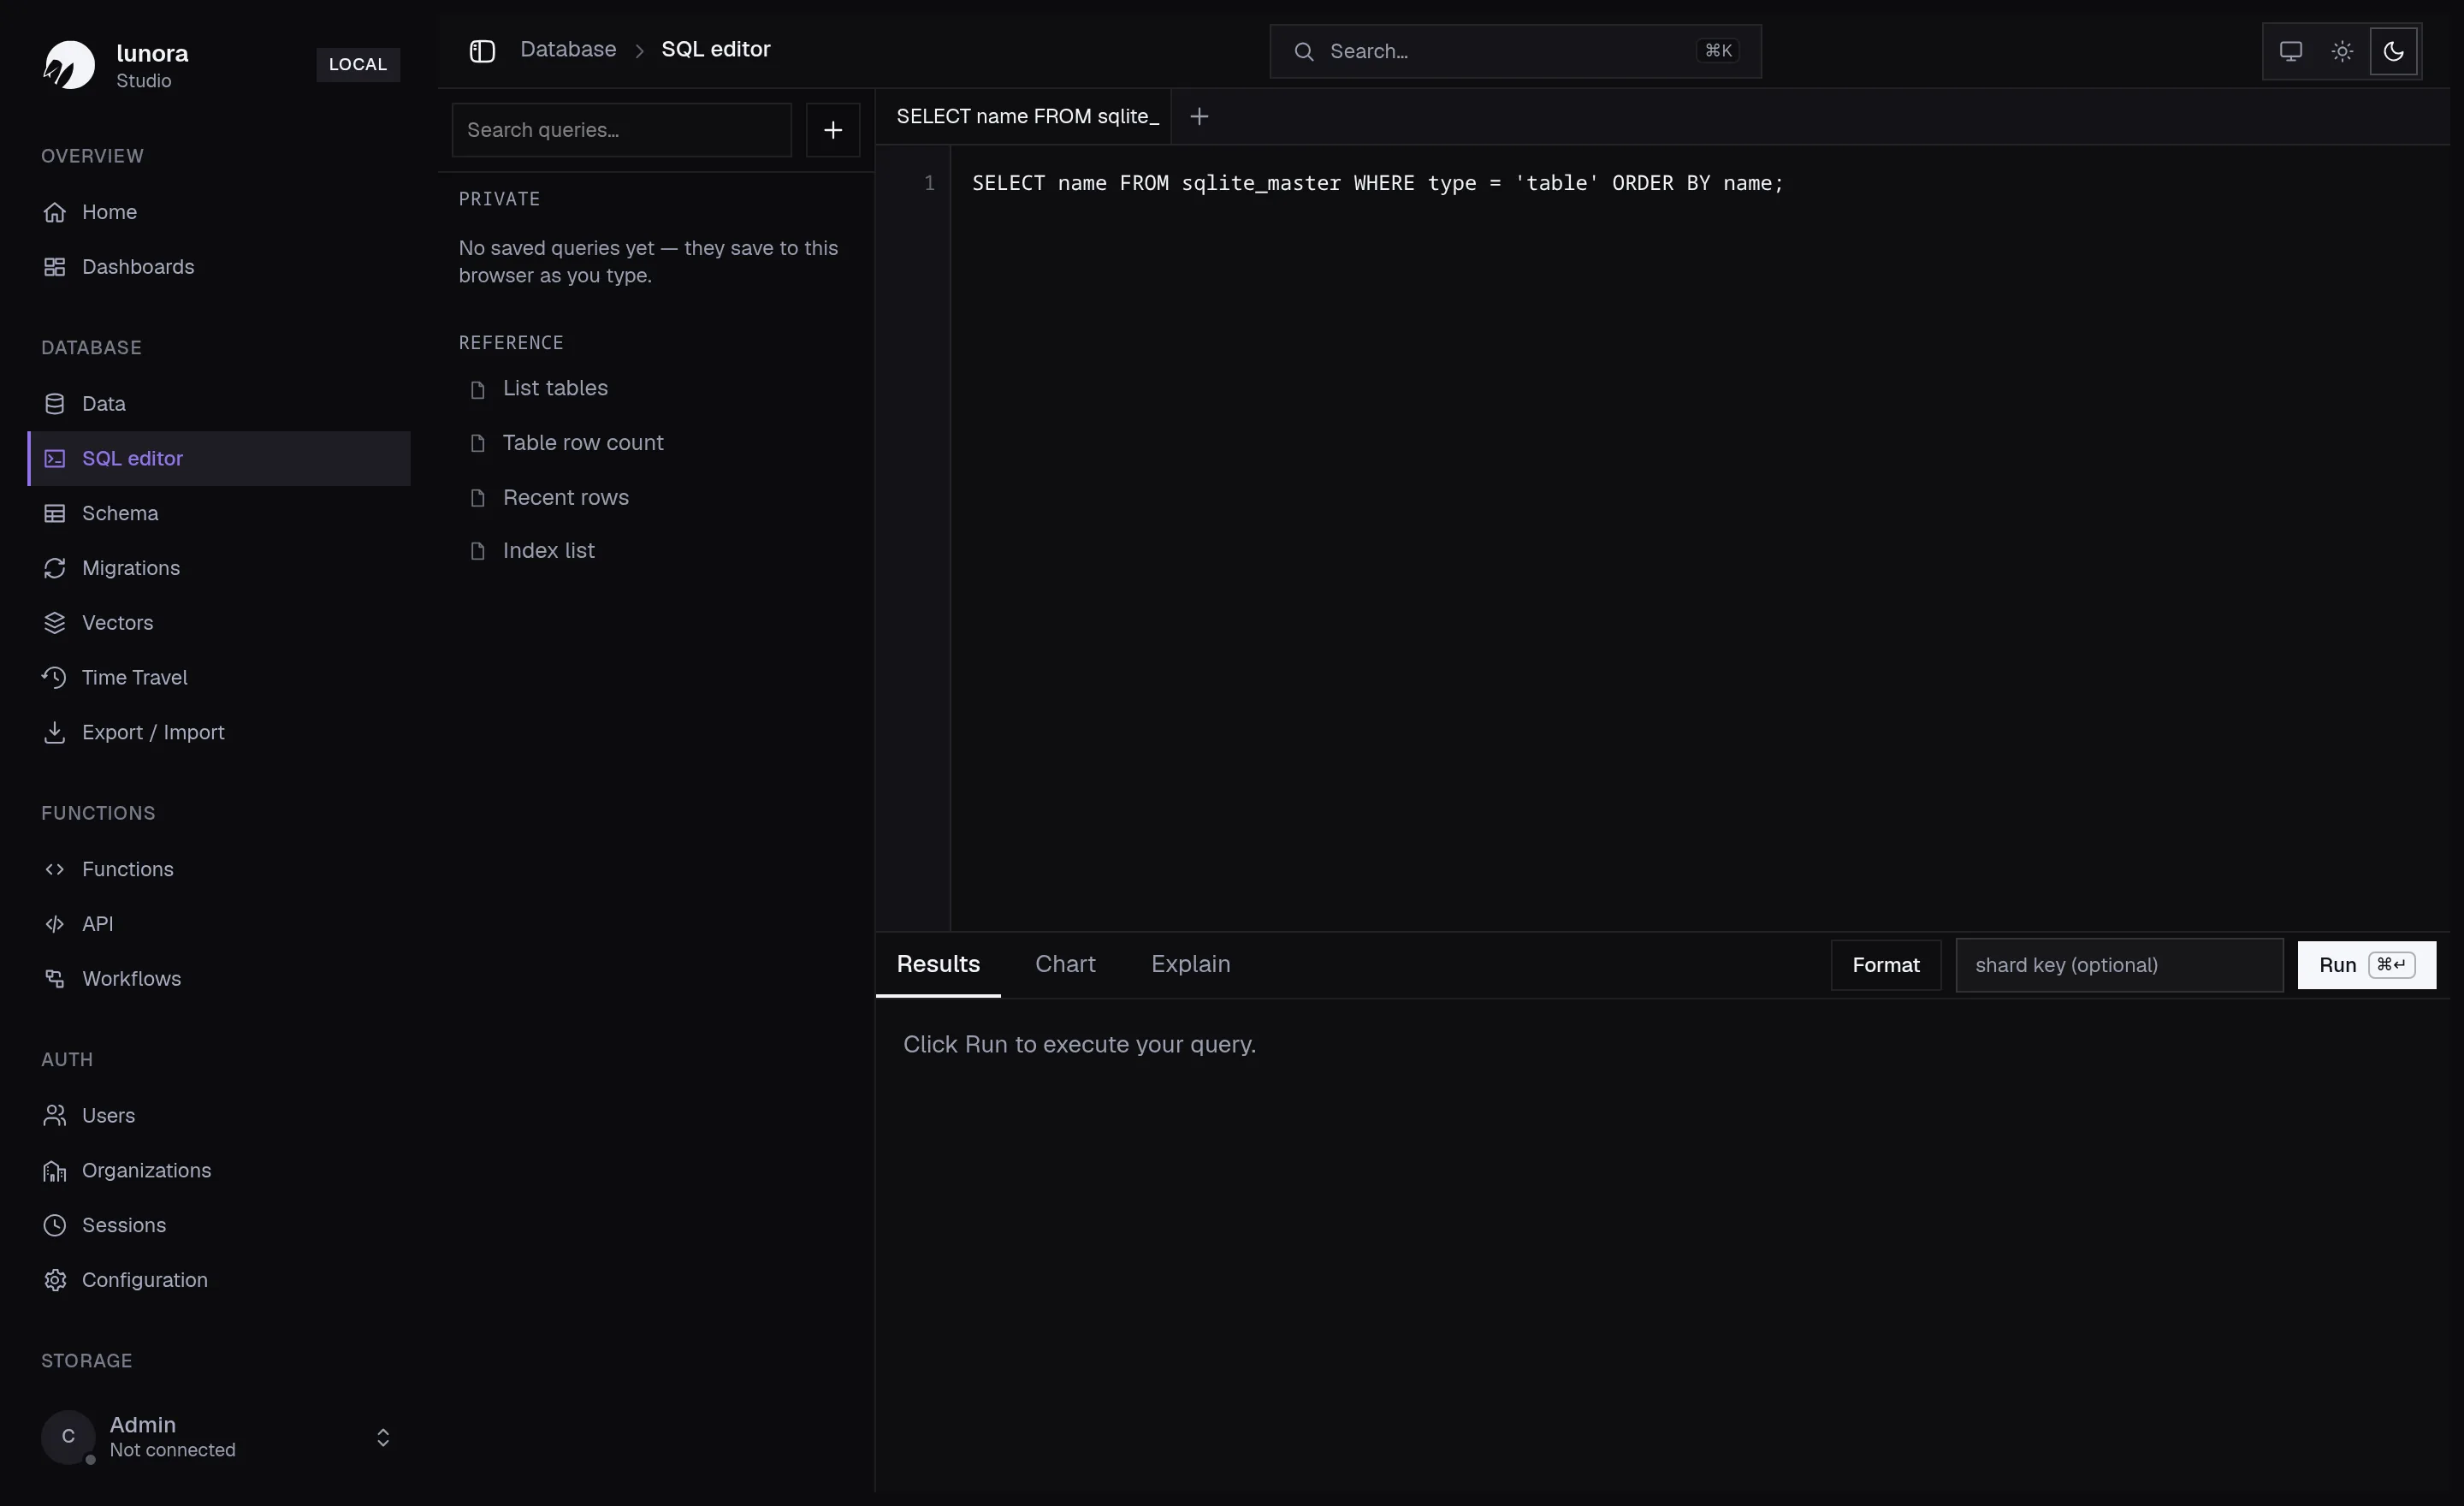
The SQL editor runs queries straight against a shard's SQLite, with Results, Chart, and Explain tabs. Save the queries you reach for often, drop in a shard key when you need a specific partition, and use the reference snippets (list tables, row counts, index list) to orient in an unfamiliar schema.
Build dashboards from saved queries
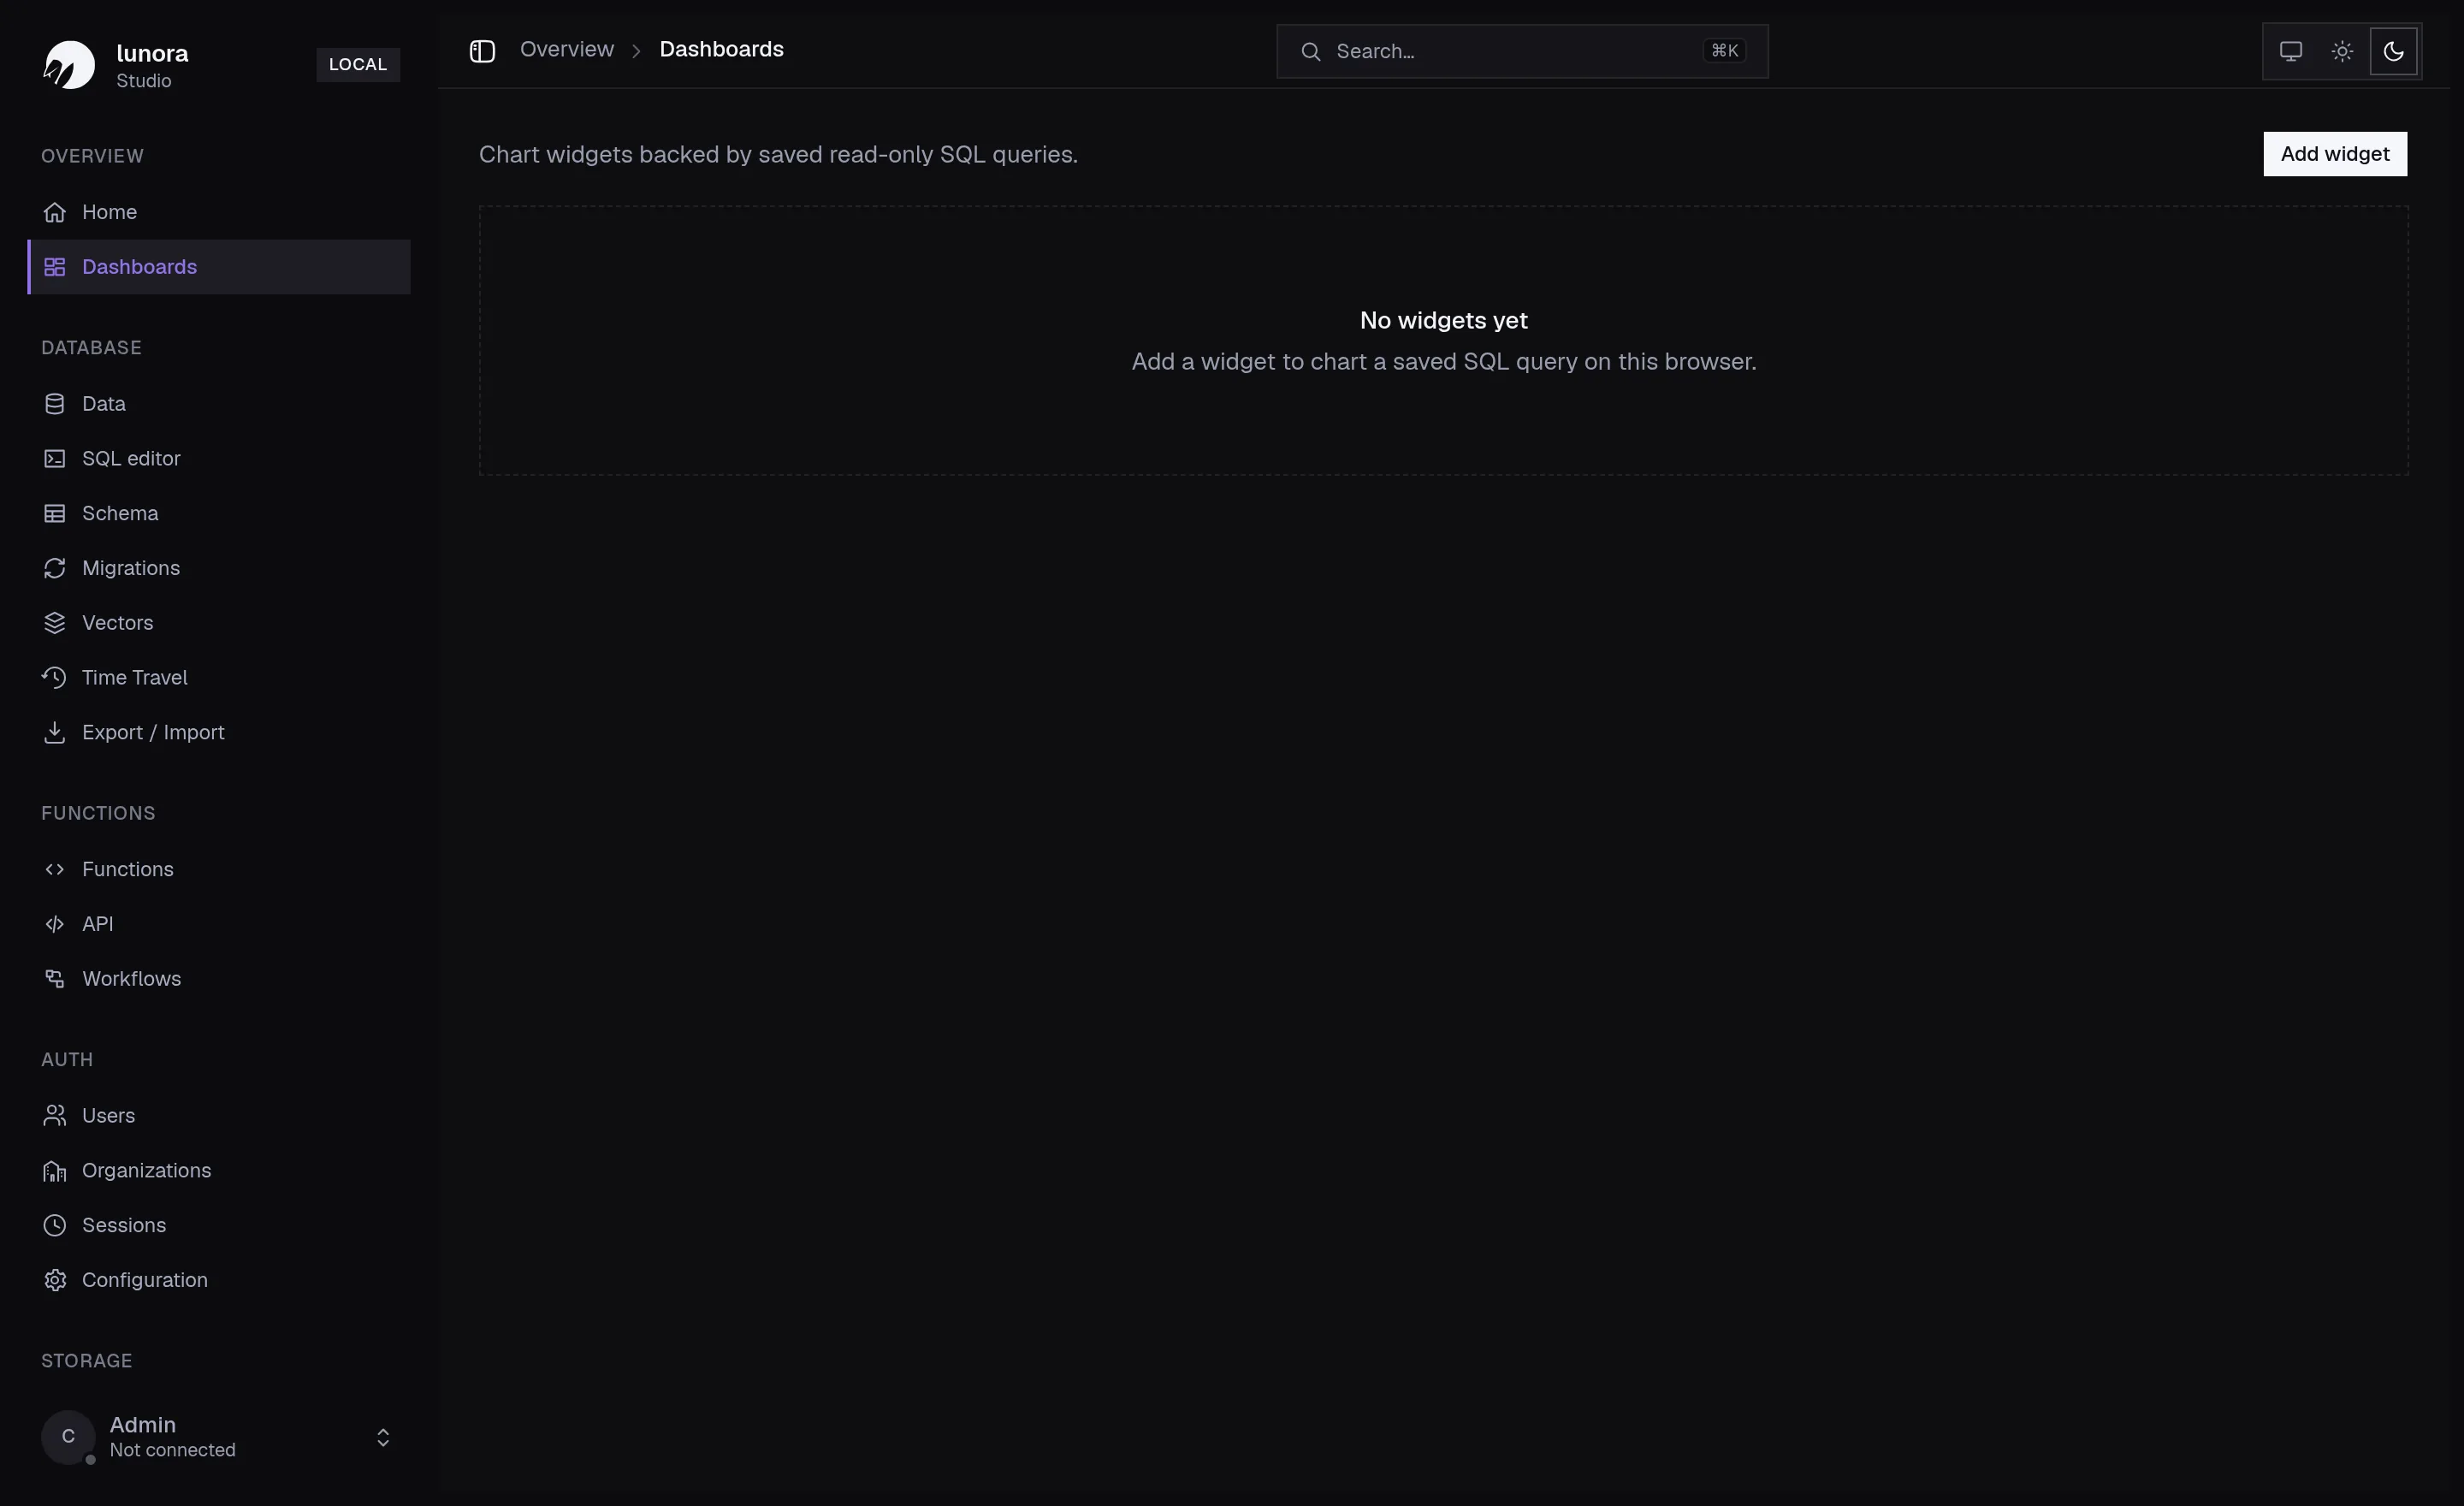
Promote any saved read-only query into a chart widget and pin it to a dashboard. It's a fast way to keep an eye on the numbers that matter — signups today, messages per hour, error rates — without standing up a separate analytics stack.
See your schema — shards and global tables
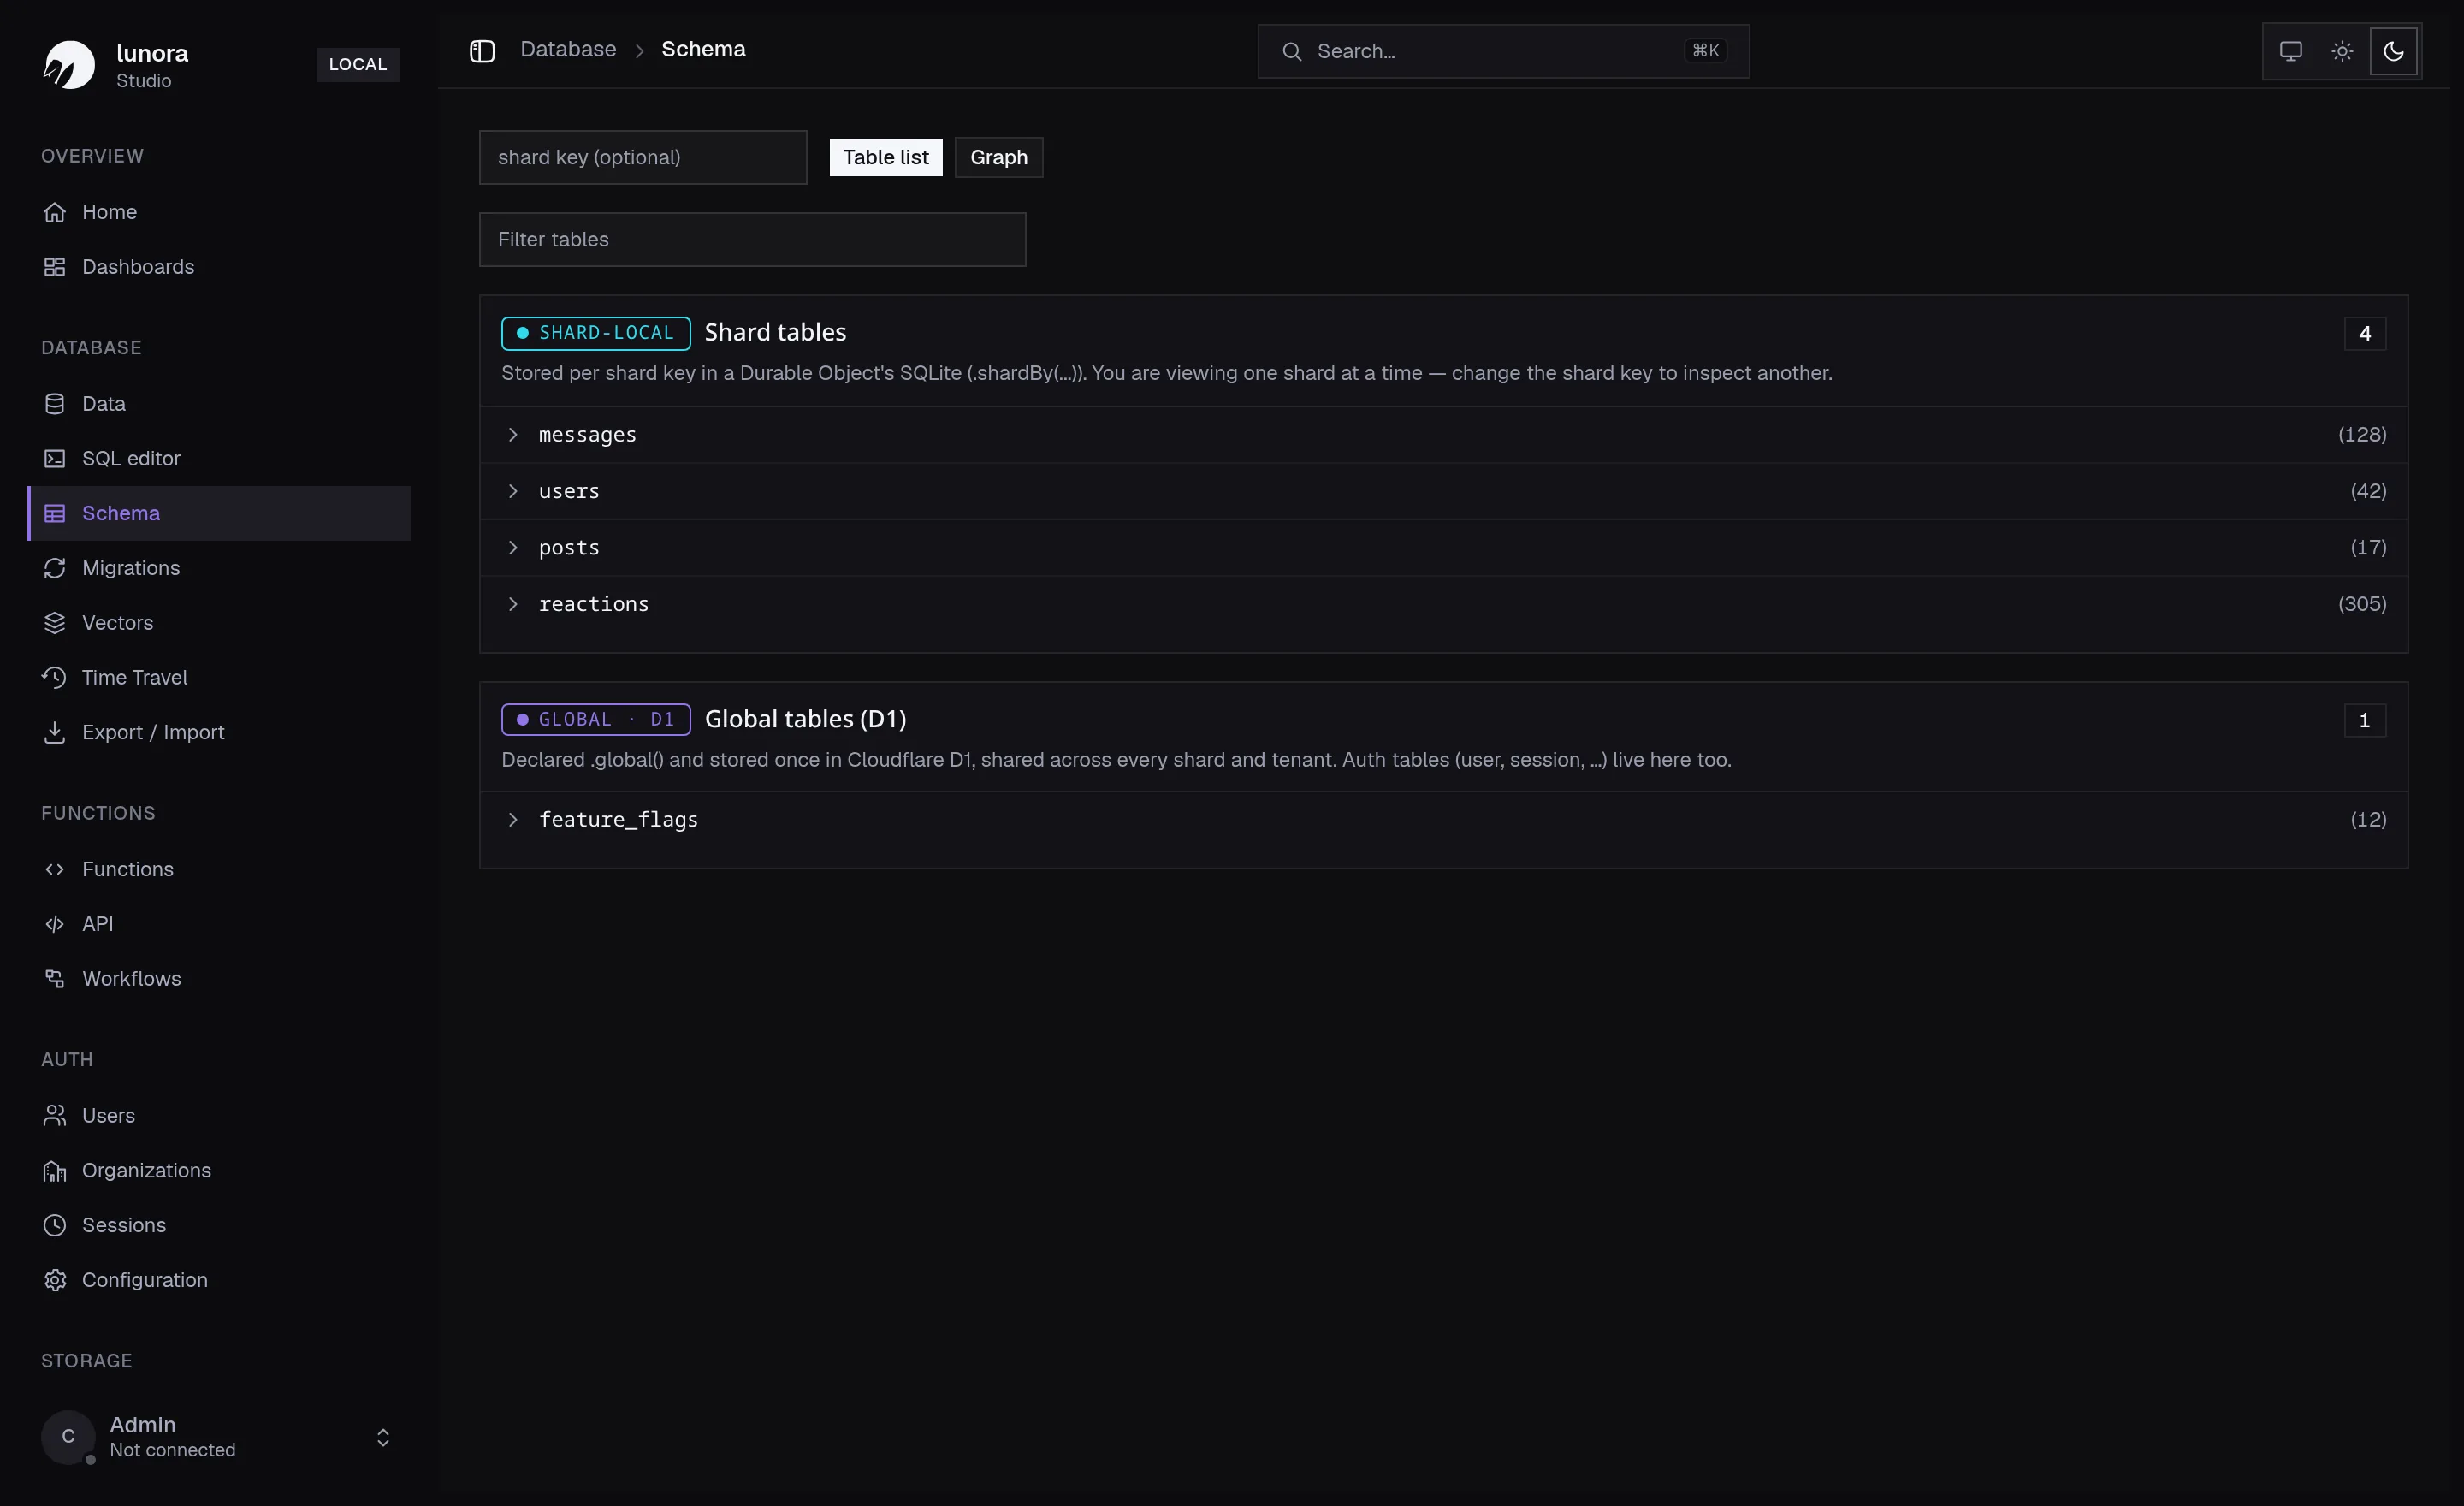
The schema view separates shard-local tables (stored per shard key inside each Durable Object's
SQLite) from global tables (declared .global() and stored once in Cloudflare D1, shared across
every shard and tenant — including the auth tables). Toggle between a table list and a relationship
graph to understand how everything connects.
Rewind any shard with Time Travel
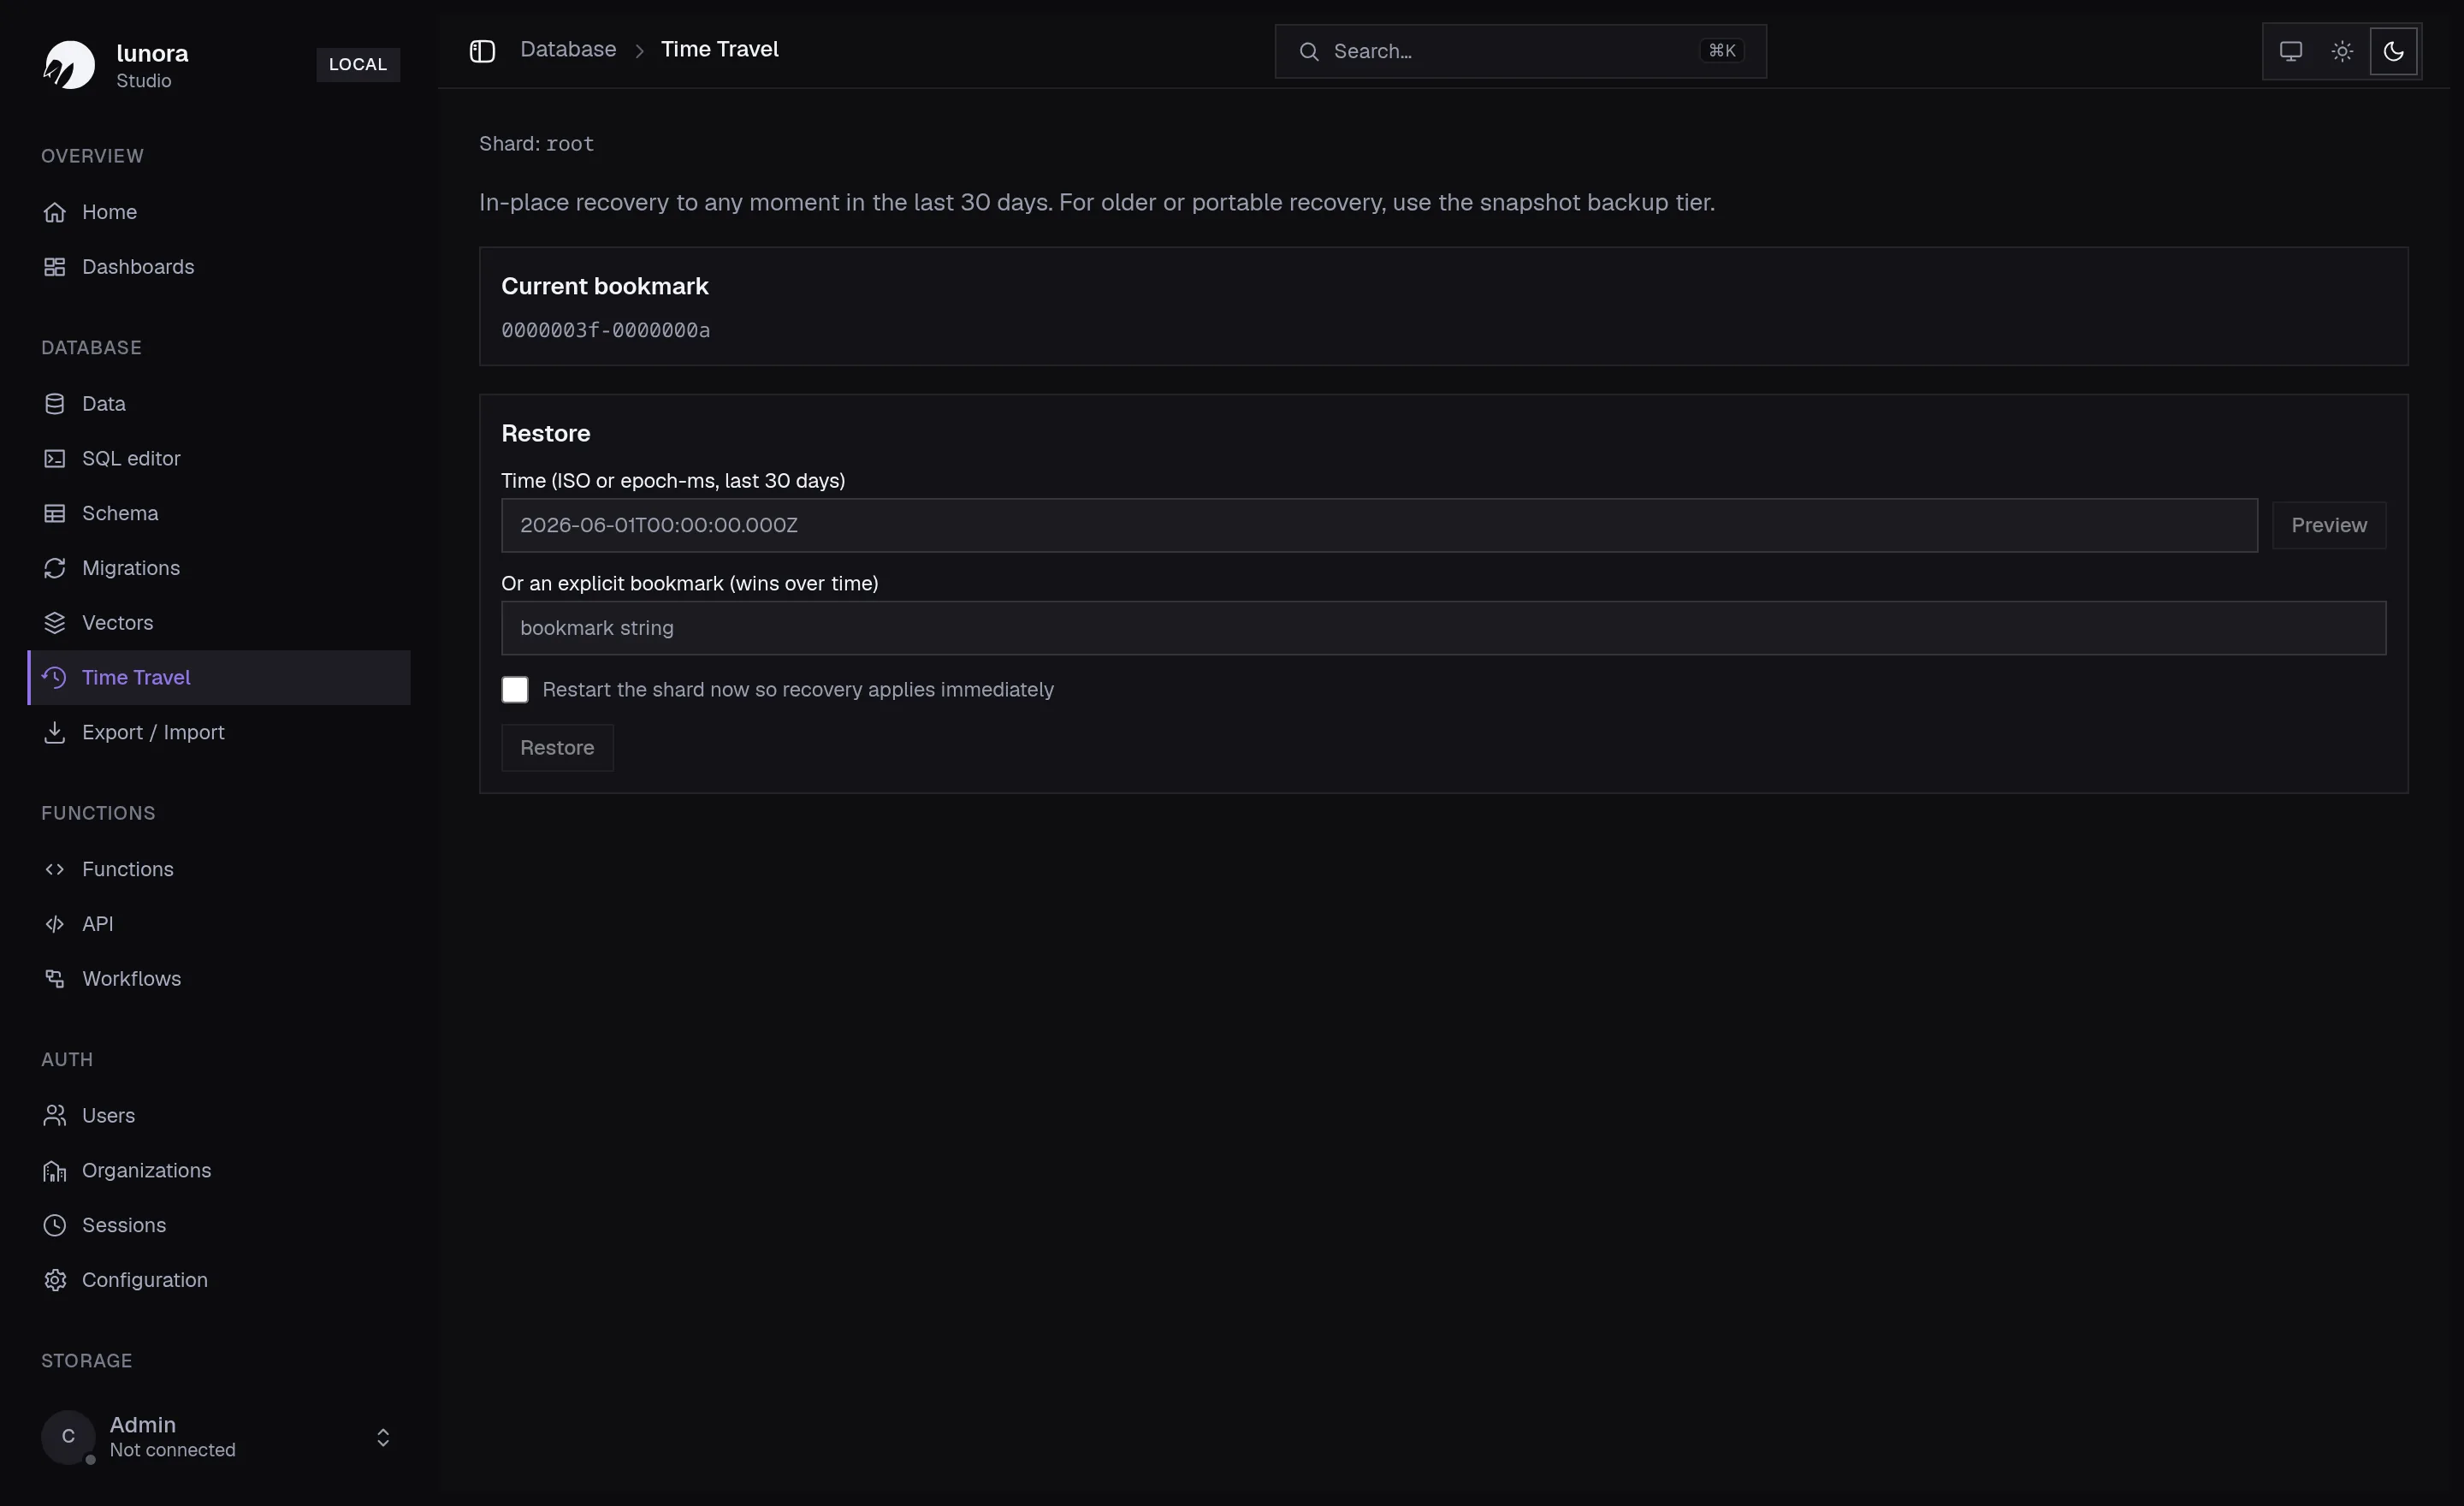
Every shard is a SQLite database with point-in-time history. Time Travel lets you scrub back to any moment in the last 30 days — by timestamp or bookmark — preview the state, and restore it in place. There's no backup job to set up first; the history is just there.
Drive durable Workflows
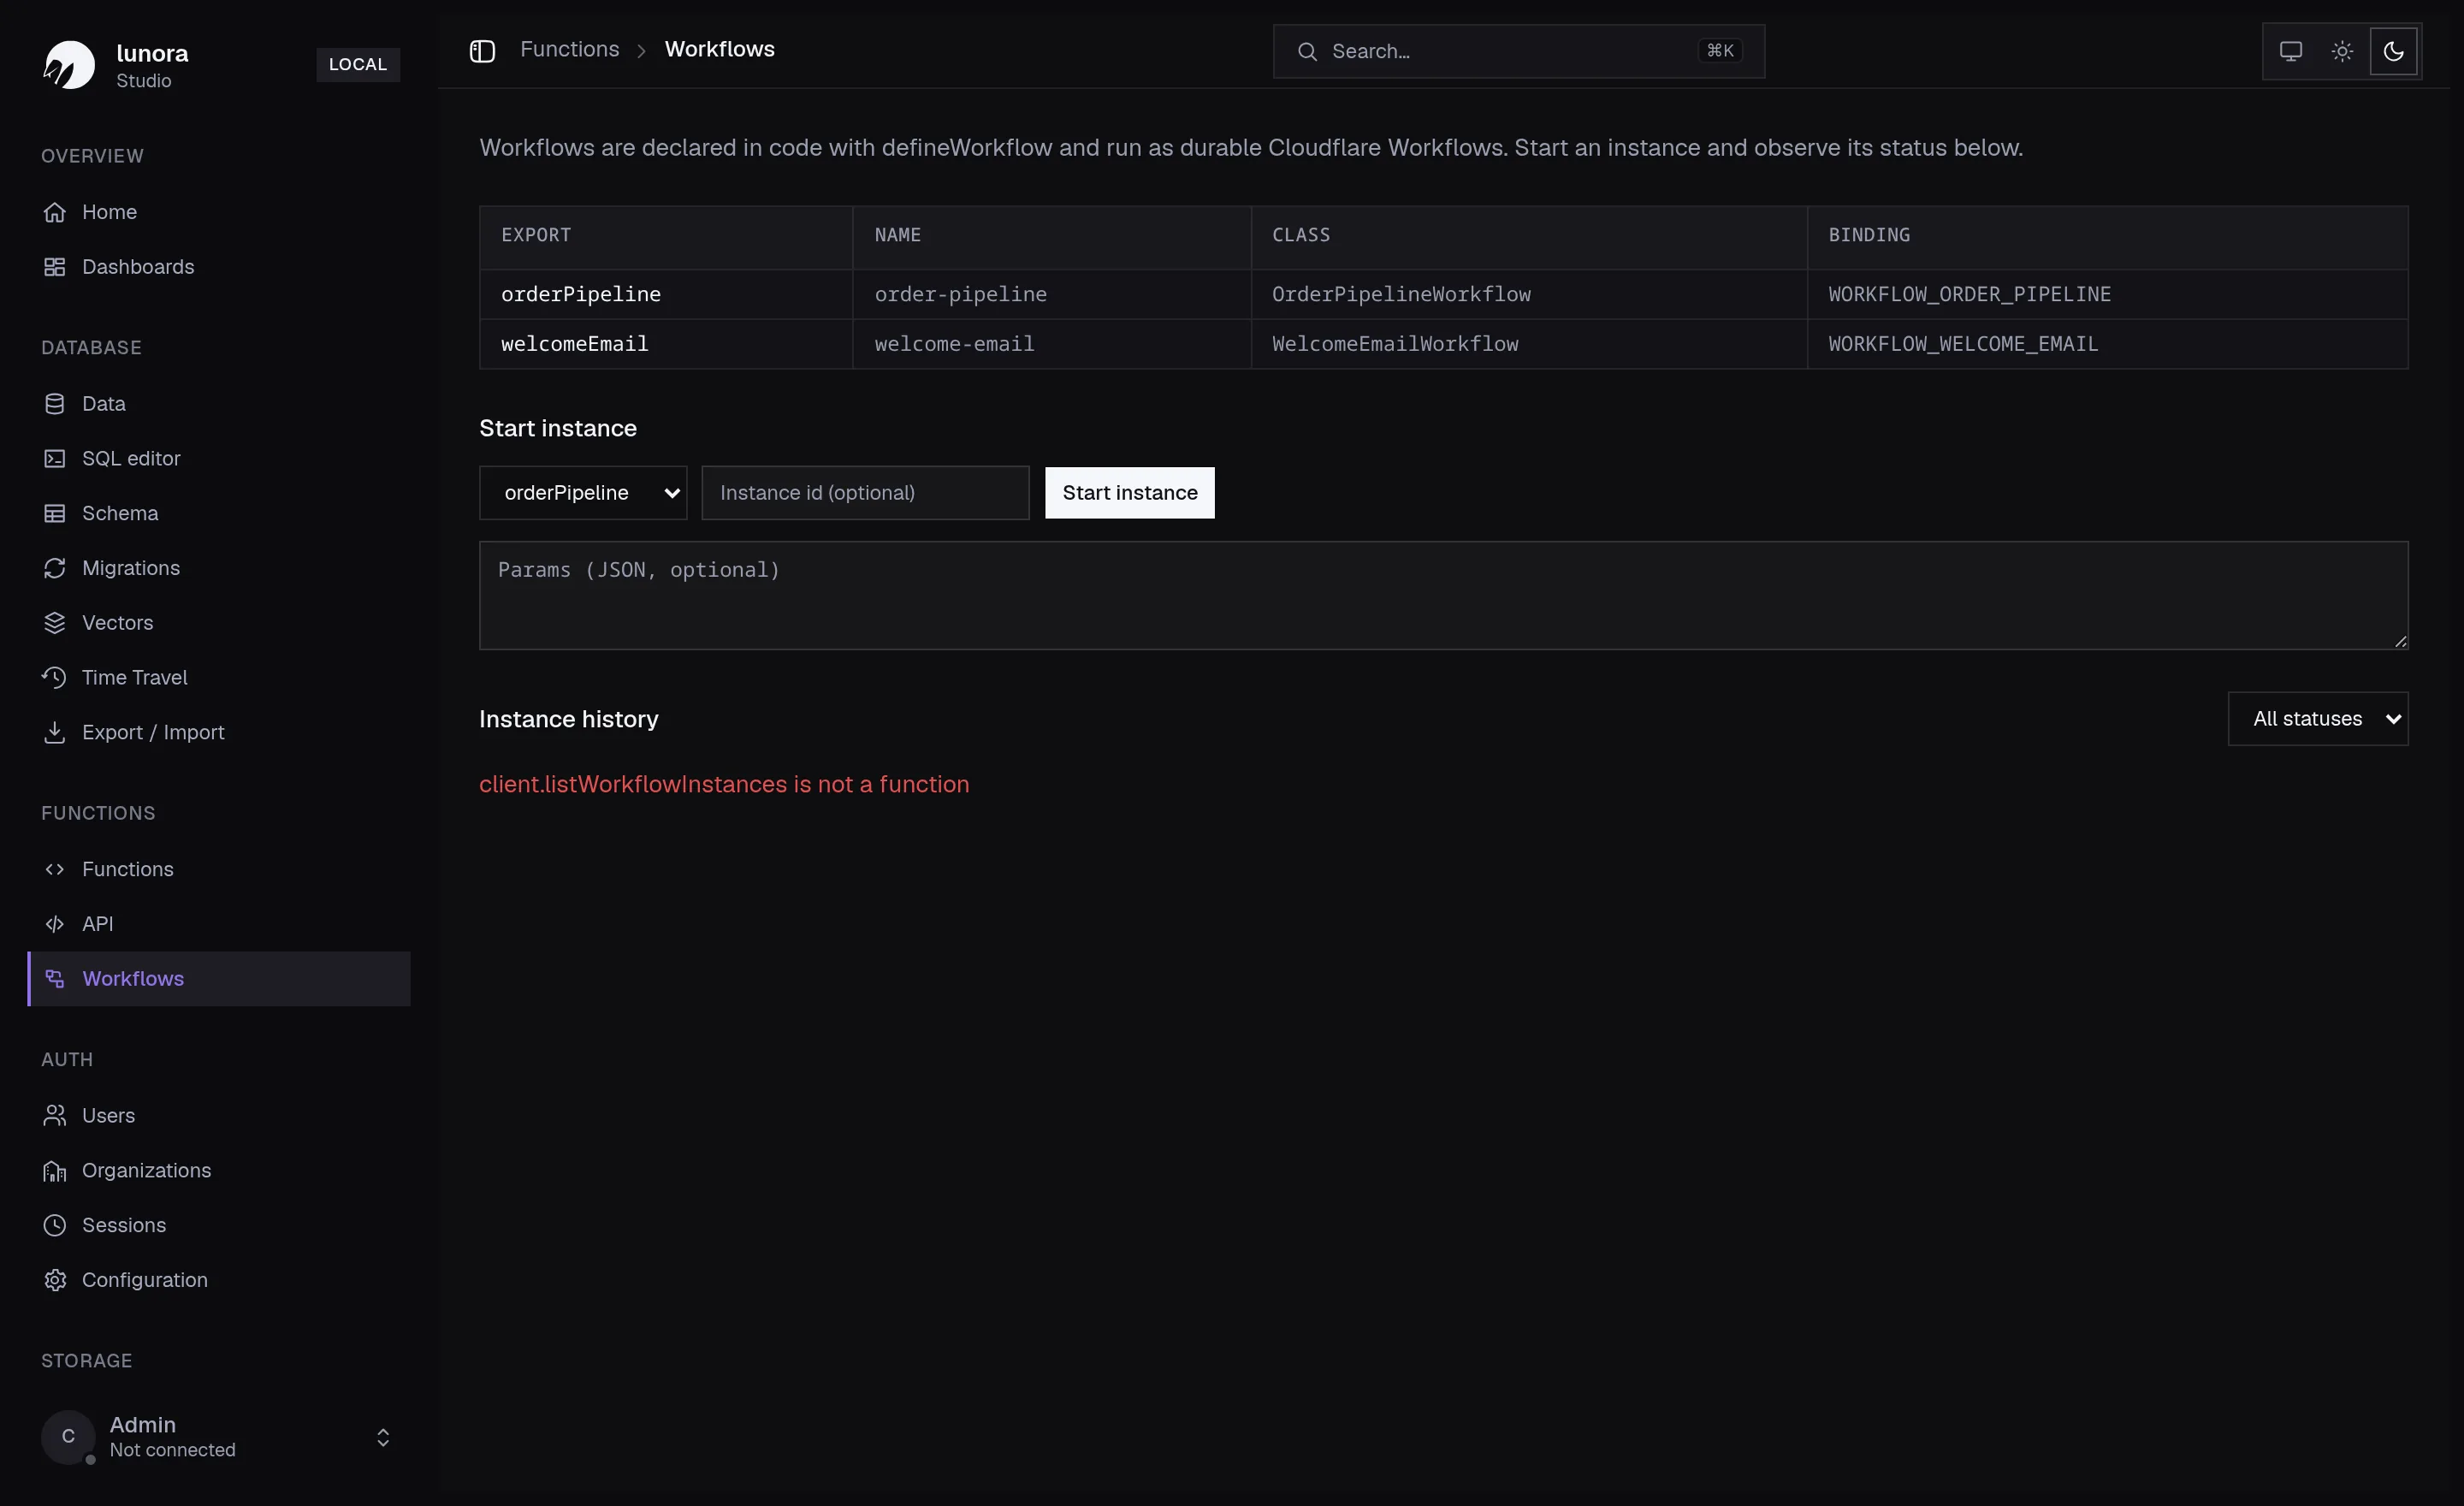
Workflows declared with defineWorkflow run as durable Cloudflare Workflows. From Studio you can see
every registered workflow, start an instance with optional JSON params, and watch its status in the
instance history — handy for kicking off and debugging long-running jobs without writing a trigger.
Advisors catch the footguns
Schema and query lints flag the usual mistakes — unindexed foreign keys, duplicate indexes, a filter with no index behind it — right in the Advisors table, surfaced as security findings and performance issues on the home screen, before they turn into a production incident.
It comes with every project
Studio isn't a separate product or a hosted dashboard — it's part of the dev loop. Run pnpm dev,
open it next to your app, and you have a console for your entire Cloudflare-native backend. See the
Studio docs to go deeper, or get started and open it for yourself.